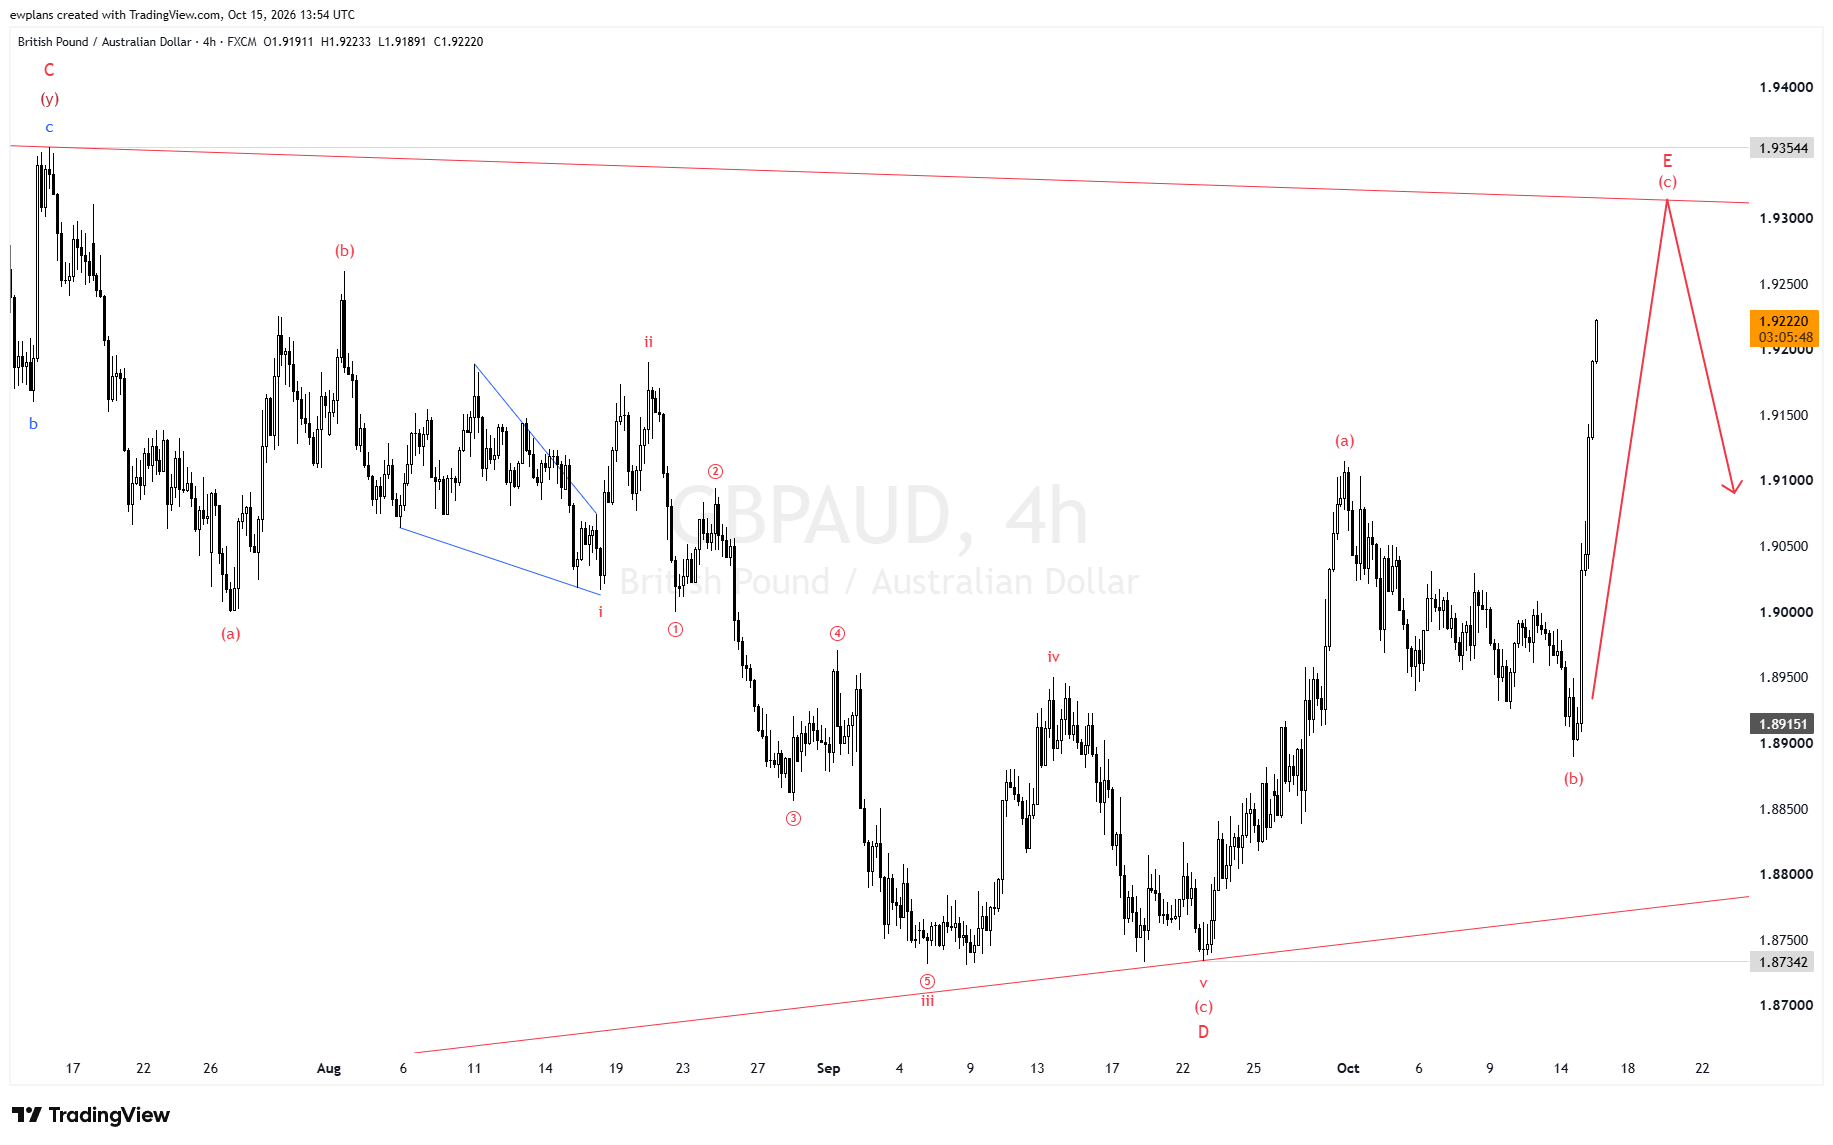
GBP/AUD Elliott Wave Analysis: Triangle Wave (E) Nears 1.9354 — Sharp Breakout Toward 1.90 Projected
GBP/AUD is approaching the completion of one of the clearest large-scale Elliott Wave contracting triangles currently visible in the cross-pair forex market. With the pattern’s final (E) wave advancing toward the upper trendline near 1.9354, a sharp directional breakout toward the 1.90–1.91 zone is projected once the triangle resolves. Here is the complete breakdown.
Elliott Wave Analysis: Where Is GBP/AUD Right Now?
Critical Levels and Wave Count
The C/(y) Peak — Near 1.935:
GBP/AUD peaked near 1.935 in mid-July, labeled C and (y) on the EWPlans chart. From this high, the pair began developing a large A-B-C-D-E contracting triangle — visible as the converging red trendlines spanning the chart.
The Triangle’s Development:
(a)-(b) legs: Initial corrective moves following the peak
i-ii and ①②③④: A detailed internal stepping decline through August and early September
⑤/iii/D: Touched the lower ascending trendline near 1.8734, confirming the triangle’s lower boundary
(a) wave: Rallied within the triangle toward approximately 1.910
(b) wave: Corrected to approximately 1.8915
Wave (E) — NOW ACTIVE:
From the (b) low, a sharp advance has launched — the final E/(c) wave of the triangle. Current price at 1.92220 is advancing toward the upper trendline near 1.93544, where the (E) wave is projected to complete.
Why This Triangle Matters
Contracting triangles are known for producing sharp, decisive breakouts once their final (E) wave completes — the converging price action compresses volatility, which is then released abruptly. The EWPlans chart illustrates this with the projected path: a final touch of the 1.9354 boundary, followed by a sharp reversal toward 1.90–1.91.
Expected Scenario and Potential Moves
Current Phase — Wave (E) completing near 1.9354:
GBP/AUD advances from current price 1.92220 toward the upper triangle boundary.
Next Phase — Sharp breakout lower:
Once the (E) wave completes, the chart projects a decisive reversal toward the 1.90–1.91 zone.
Key structural reference points:
1.93544: Triangle upper boundary — (E) wave target
1.92220: Current price
1.90500: Post-breakout initial target
1.89151: (b) wave low
1.87342: Triangle lower boundary
Strategic Perspective for Traders
1. The 1.9354 zone is the key level to watch. A clean touch and reversal would confirm the triangle’s completion and the start of the projected breakout.
2. A sustained close above 1.9354 would challenge the pattern. This remains the key risk reference for the bearish breakout scenario.
3. RBA and BoE policy divergence, along with broader risk sentiment, are the primary macro variables that could influence the timing and pace of the breakout.
Conclusion — Follow GBP/AUD’s Wave Structure With EWPlans
GBP/AUD’s large contracting triangle is nearing its final wave. Once Wave (E) completes near 1.9354, a sharp breakout toward 1.90–1.91 is the projected move.
At EWPlans, we publish H4 and D1 Elliott Wave analysis on GBP/AUD and 38 other instruments every single day.
👉 Get daily wave counts for GBP/AUD and 38 more instruments — Start Your Analysis at EWPlans.com