NZD/USD Elliott Wave Analysis: Wave iii Peaks at 0.5864 — Wave iv Pullback Sets Up Wave v Toward 0.5900+
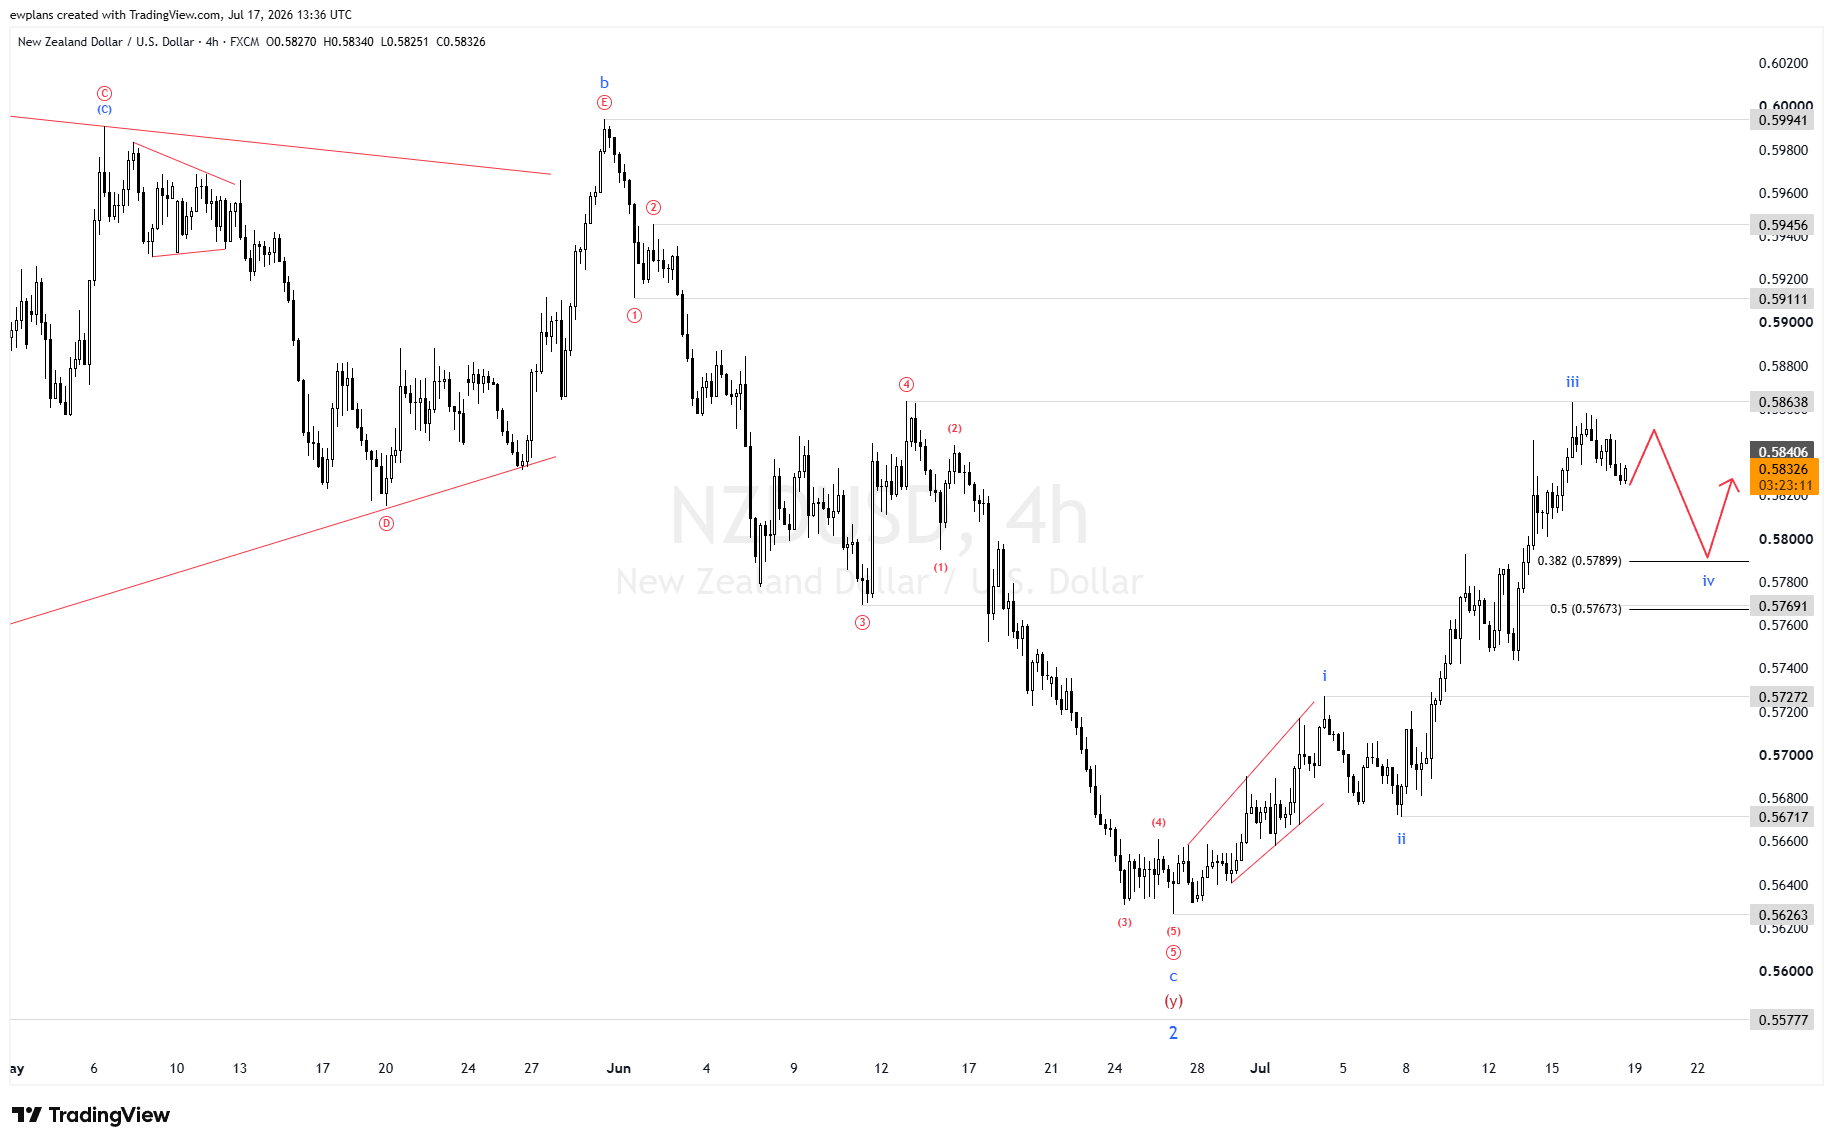
NZD/USD may be offering one of the clearest Elliott Wave entry setups in the current forex landscape. After establishing a major structural low near 0.5600 and launching a textbook five-wave bullish impulse, the pair has completed Wave iii at 0.5864 and is now entering the Wave iv corrective pullback phase. The 0.382–0.5 Fibonacci zone at 0.5767–0.5790 defines the structural entry opportunity, and Wave v targeting 0.5900+ is the projected outcome once Wave iv exhausts. Here is the complete breakdown.
Elliott Wave Analysis: Where Is NZD/USD Right Now?
Critical Levels and Wave Count
The NZD/USD H4 Elliott Wave picture begins with the completion of a significant large-scale bearish sequence that established the structural foundation for the current bullish impulse. On the left side of the chart, a multi-phase corrective and impulsive structure unfolded through May and June 2026:
Large-Scale Bearish Context — Prior Structure:
The chart shows a complex sequence beginning with a (c)/(c) contracting triangle in early May 2026 — a structure with converging trendlines and a terminal (E) wave completing the pattern. The b/(E) high near approximately 0.5994 represented the terminal peak of this prior corrective structure before the large-scale decline resumed.
Following the b/(E) high, a bearish impulse sequence developed with ①-②-③-④-⑤ labeling, driving NZD/USD lower through June 2026. The internal structure included:
Wave ① drop, Wave ② bounce, Wave ③ impulse, Wave ④ correction
A second set of (1)-(2)-(3)-(4)-(5) waves continuing the decline
An internal (4) contracting triangle with the ascending wedge visible on the chart
The terminal (5)/(⑤)/c/(y) wave completing the entire large-scale bearish structure near 0.5600
Wave 2 / Major Structural Low:
The c/(y)/2 low near 0.5600 (labeled as 2 on the EWPlans chart) represents the terminal point of the entire W-X-Y Wave 2 corrective structure at the higher degree. This is the structural base from which the current five-wave bullish impulse launched — and it now serves as the ultimate structural floor for the entire bullish count.
New Five-Wave Bullish Impulse — NOW DEVELOPING:
From the 0.5600 structural low, a fresh five-wave bullish impulse launched with clear internal structure:
Wave i: The initial bullish leg from the 0.5600 low, rallying toward approximately 0.5740 — establishing the directional bias and confirming that the large-scale corrective structure was genuinely complete. The wave i high is labeled (i) on the EWPlans chart.
Wave ii: The corrective retracement from the Wave i high, pulling NZD/USD back toward approximately 0.5667–0.5672 — labeled as (ii) on the chart. This level now serves as the Invalid Level at 0.56717: any confirmed H4 close below this level would invalidate the current five-wave bullish count and require structural reassessment.
Wave iii — COMPLETE: The most powerful and extended sub-wave of the bullish impulse launched from the Wave ii low and drove NZD/USD to approximately 0.5864 — labeled as (iii) on the EWPlans chart. This Wave iii advance covered approximately 192 pips from the ii low to the iii high — the most significant single directional move in this entire new bullish sequence.
Wave iv — NOW ACTIVE: The corrective pullback from the Wave iii high near 0.5864 has begun. Current price at 0.58326 represents the early stages of this Wave iv correction. The structural target zone for Wave iv completion is defined by Fibonacci retracements of the Wave iii advance:
0.382 retracement → 0.57899 — the minimum expected Wave iv depth (labeled on chart)
0.5 retracement → 0.57673 — the deeper retracement scenario (labeled on chart)
Wave v — NEXT: Once Wave iv completes in the 0.5767–0.5790 zone and the correction exhausts, Wave v — the final completing leg of the five-wave bullish impulse — is projected to drive NZD/USD toward 0.5900 and beyond, as shown by the red arrow on the EWPlans chart.
Why Wave iv Pullbacks Are the Structural Entry Opportunity
The current Wave iv pullback in NZD/USD deserves specific attention as one of the highest-quality structural setups available in the Elliott Wave framework.
In Elliott Wave theory, Wave iv corrections share several key characteristics that make them structurally significant for traders:
1. Wave iv corrections are continuation patterns — not reversals. The Wave iv pullback from the 0.5864 high is not a signal that the bullish trend is ending. It is a normal, expected, and necessary component of the five-wave impulse structure. Wave iv resets momentum and sentiment before Wave v completes the sequence.
2. Wave iv typically retraces 38.2%–50% of Wave iii. The two Fibonacci levels marked on the EWPlans chart — 0.57899 (0.382) and 0.57673 (0.5) — represent the standard Wave iv depth range. Price finding support anywhere in this zone provides the structural confirmation that Wave iv is complete and Wave v is ready to launch.
3. Wave iv cannot enter Wave i territory. By Elliott Wave rule, Wave iv cannot close below the Wave i high. In the NZD/USD count, the Wave i high sits significantly above the current corrective zone — meaning the Wave iv pullback has structural room to develop within the 0.5767–0.5790 zone without violating this rule.
4. The Invalid Level at 0.56717 provides a clear risk reference. The Wave ii low at 0.56717 is the hard structural floor for the entire bullish count. Any Wave iv correction that closes below this level on H4 timeframe would violate the Elliott Wave rules for this impulse count — providing traders with a clear, non-ambiguous structural reference point.
5. Wave v targets are measurable from the Wave iv low. Once Wave iv completes in the 0.5767–0.5790 zone, Wave v can be projected using standard Fibonacci ratios from the Wave iv low. Typical Wave v targets in five-wave sequences include equality with Wave i (approximately 68–75 pips) or 0.618 times Wave iii — both pointing toward the 0.5900+ zone shown on the EWPlans chart.
Expected Scenario and Potential Moves
The primary Elliott Wave scenario for NZD/USD unfolds in two sequential phases:
Phase 1 (Current — Wave iv correction): Price pulls back from the 0.5864 Wave iii high toward the structural support zone of 0.5767–0.5790 (0.382–0.5 Fibonacci retracements). The Wave iv correction may take the form of a simple zigzag or flat correction — typical Wave iv structures. The key requirement is that price holds above the Invalid Level at 0.56717 on all H4 closes during this correction.
Phase 2 (After Wave iv — Wave v launch): Once Wave iv finds support in the 0.5767–0.5790 zone and the corrective structure is complete, Wave v launches the final bullish leg toward 0.5900+. The 0.5900 zone aligns with the larger structural resistance context visible on the chart — including the 0.5911 and 0.5946 levels — making it the primary target zone for the Wave v completion.
Key structural reference points to monitor:
0.58638: Wave iii high — now immediate resistance
0.58326: Current price — Wave iv pullback in early stages
0.57899: 0.382 Fibonacci — Wave iv minimum target
0.57673: 0.5 Fibonacci — Wave iv deeper scenario
0.57272: Structural support below the iv zone
0.56717: Invalid Level — Wave ii low / hard structural floor
0.5900+: Wave v primary target zone
Strategic Perspective for Traders
The NZD/USD H4 Elliott Wave setup presents a clear and well-defined structural framework for traders who follow wave-based analysis:
1. The 0.5767–0.5790 zone is the structural entry opportunity. With Wave iv expected to retrace toward this Fibonacci zone, traders who understand the wave context can treat this area as the structural setup for Wave v. Price behavior — reversal candles, momentum divergence, volume patterns — in this zone will provide the technical confirmation that Wave iv is complete.
2. The Invalid Level at 0.56717 defines the trade's structural validity. The clarity of the Invalid Level in this setup is one of its strongest features. The risk framework is unambiguous: Wave iv correcting to 0.5767–0.5790 and reversing is the bullish thesis; a close below 0.56717 is the structural invalidation. This binary clarity is a hallmark of high-quality Elliott Wave setups.
3. Wave iii momentum quality confirms the bullish count. The Wave iii advance from approximately 0.5672 (ii low) to 0.5864 (iii high) — a move of nearly 200 pips — is consistent with a genuine, high-quality third wave in a real five-wave bullish impulse. The momentum and range of Wave iii give confidence to the Wave iv/v setup that follows.
4. The 0.5600 structural low is the long-term anchor. Whatever the depth of the Wave iv correction, the 0.5600 c/(y)/2 low represents the ultimate structural floor. A Wave iv correction to 0.5767–0.5790 — well above the 0.5600 base — keeps the larger bullish structure from 0.5600 fully intact and sets up the five-wave completion near 0.5900.
5. RBNZ policy, Chinese macro, and risk appetite are the primary external variables. NZD/USD is particularly sensitive to RBNZ monetary policy decisions and Chinese economic data — given New Zealand's significant trade linkages with China. Any RBNZ dovish surprises or weak Chinese data could deepen the Wave iv correction toward 0.5767 or below. Conversely, hawkish RBNZ communication or strong Chinese data could shorten Wave iv and accelerate the Wave v launch.
Conclusion — Follow NZD/USD's Wave Structure With EWPlans
NZD/USD is at a structurally precise and opportunity-rich moment. Wave iii has completed at 0.5864, Wave iv is pulling back toward the 0.5767–0.5790 Fibonacci support zone, and Wave v targeting 0.5900+ is the structural move that follows. The Elliott Wave framework delivers a clear map of the setup, the entry zone, the risk level, and the target — everything traders need to approach this pair with structural confidence.
At EWPlans, we publish H4 and D1 Elliott Wave analysis on NZD/USD and 38 other instruments every single day. Our EWP Nexus-powered wave counts are built for forex traders who demand structural precision, clear entry zones, and consistent analytical quality across every market they track.
👉 Get daily wave counts for NZD/USD and 38 more instruments — Start Your Analysis at EWPlans.com