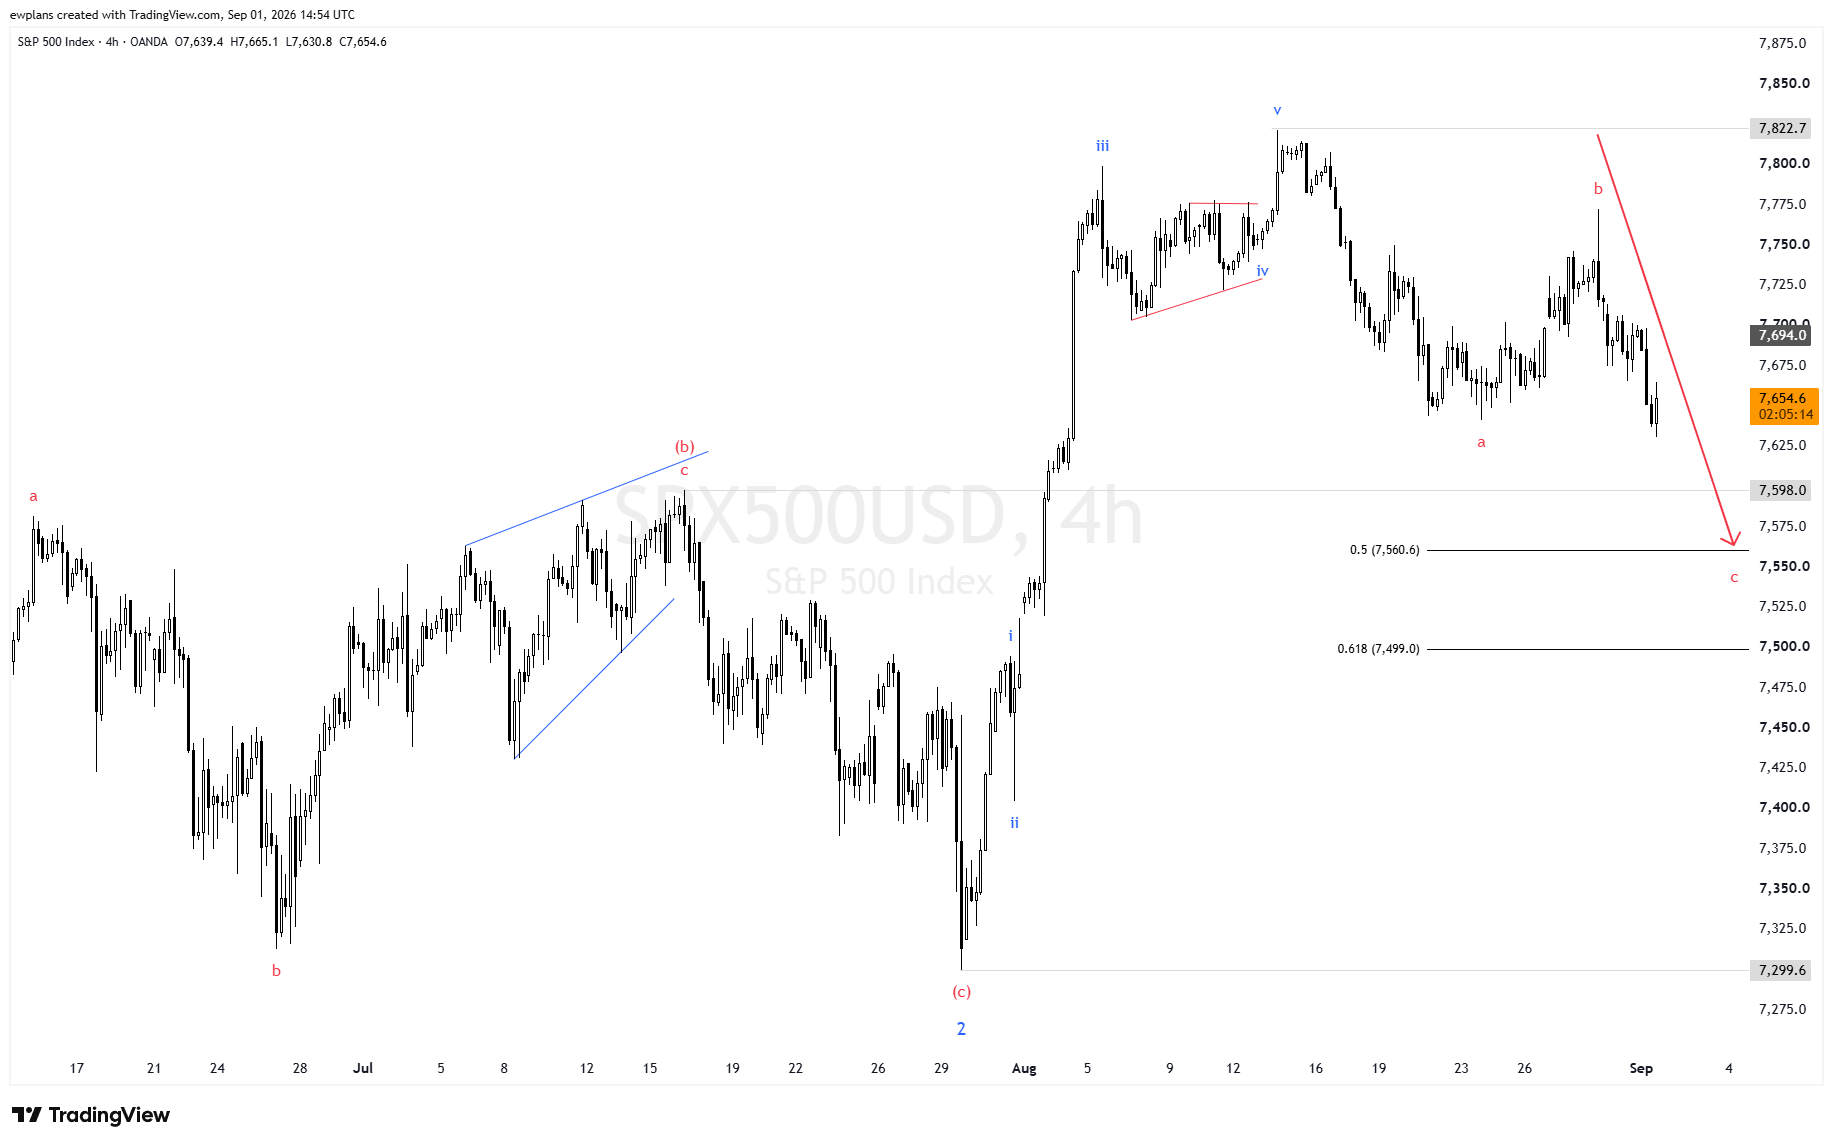
S&P 500 Elliott Wave Analysis: Wave ② c-Leg Targets 7,560 — Structural Buy Zone Before Wave ③ Bull Run
The S&P 500 is at a structurally defining moment for equity markets in September 2026. After completing a textbook five-wave bullish impulse as Wave ① near 7,822.7 — including a precision contracting triangle Wave (iv) — the index entered Wave ② A-B-C correction with the a and b legs complete. The c-leg is now declining toward the 0.5 Fibonacci at 7,560.6 (TP1) or 0.618 Fibonacci at 7,499.0 (TP2). Once Wave ② completes in this structural buy zone, Wave ③ — the most powerful bullish impulse of the sequence from the 7,299.6 base — launches above 7,822.7 into new territory. Here is the complete breakdown.
Elliott Wave Analysis: Where Is US500 Right Now?
Critical Levels and Wave Count
The S&P 500 H4 Elliott Wave picture for September 2026 is built on a multi-phase structural foundation that traces back to the (c)/2 bottom at 7,299.6 — one of the most significant structural lows in the index's 2026 trading history.
Prior Context — The a-b-(b)/c Corrective Structure:
Before the (c)/2 bottom, the chart shows a corrective sequence:
a wave: The initial decline on the left portion of the chart
b wave: The corrective low near 7,300 area — labeled b on the chart
(b) rising channel: A blue rising channel forms as the counter-trend corrective structure, developing an a-b-c zigzag recovery toward the (b)/c high near approximately 7,560–7,580
This (b)/c high exhausted the counter-trend recovery and triggered the sharp decline that followed.
The (c)/2 Structural Low — 7,299.6:
The sharp decline from the (b)/c high drove the S&P 500 down through i and ii sub-waves before the (c)/2 terminal was reached at approximately 7,299.6 — labeled (c) and 2 on the EWPlans chart. This level established the large-scale Wave 2 structural low — the foundation from which the entire current bullish sequence launched.
Wave ① — Five-Wave Bullish Impulse with Contracting Triangle (iv) (COMPLETE):
From the 7,299.6 Wave 2 low, Wave ① developed as a five-wave bullish impulse with exceptional internal structure:
i wave: The initial impulse from the 7,299 low, labeled i on the EWPlans chart, driving the S&P 500 from approximately 7,299 toward 7,490.
ii wave: The corrective retracement, labeled ii, pulling back toward approximately 7,350–7,370 before the most powerful advance began.
iii wave: The most powerful sub-wave — labeled iii on the chart — driving the S&P 500 through 7,700 toward approximately 7,820. This wave covered the most significant ground in the shortest time, demonstrating the characteristic momentum of a genuine third wave in full extension.
iv wave — Contracting Triangle: Following the iii wave high, a textbook contracting triangle formed as the iv wave — visible with the converging red trendlines on the EWPlans chart. The a-b-c-d-e structure of this triangle, with converging upper and lower trendlines, is one of the most structurally significant features of the entire Wave ① sequence. In Elliott Wave theory, a contracting triangle in the iv wave position:
Confirms the prior iii wave was genuine
Signals that only the v wave remains
Provides the most reliable pre-final-thrust pattern available
v wave: The thrust from the triangle's terminal point, completing Wave ① at approximately 7,822.7 — labeled v on the chart.
Wave ② — A-B-C Correction (c-LEG NOW ACTIVE):
From the Wave ① terminal at 7,822.7, the corrective Wave ② launched as an A-B-C three-wave structure:
a wave: The initial corrective decline from the 7,822.7 Wave ① high, declining toward approximately 7,625 — labeled a on the EWPlans chart.
b wave: The counter-trend corrective bounce from the a-wave low, recovering toward approximately 7,775–7,780 — labeled b on the chart. The b-wave recovery toward this level completes the middle segment of the Wave ② correction.
c wave — NOW ACTIVE: The final and typically most impulsive leg of the A-B-C Wave ②, declining from the b-wave high toward the Fibonacci support zone. Current price at 7,654.6 is in the declining phase of the c-wave. The two mapped completion targets are:
TP1: 7,560.6 (0.5 Fibonacci retracement of Wave ①)
TP2: 7,499.0 (0.618 Fibonacci retracement of Wave ①)
Wave ③ — THE NEXT MAJOR ADVANCE:
Once Wave ② completes in the 7,560–7,499 structural buy zone, Wave ③ — the most powerful bullish impulse of the entire sequence from 7,299.6 — launches. Wave ③ targets above 7,822.7, driving the S&P 500 to new structural highs for this bull sequence.
The Contracting Triangle iv Wave — Why It Elevates This Setup
The contracting triangle that formed as Wave iv within Wave ① deserves specific attention as one of the most structurally significant features of the US500 Elliott Wave setup:
1. Triangles in Wave iv position are pre-impulse confirmation patterns. In Elliott Wave theory, a contracting triangle forming correctly in the iv wave position — with five identifiable a-b-c-d-e legs and converging trendlines — is one of the most reliable structural confirmations that the prior iii wave was genuine and the count is valid. The presence of this triangle in S&P 500's Wave ① sequence validates the entire count.
2. The triangle's terminal (e) wave triggered the v thrust. Once the contracting triangle completed at its terminal (e) wave, the v thrust launched directly from the lower trendline — exactly as Elliott Wave rules predict. This textbook execution further validates the structural quality of Wave ①.
3. Wave ① validation elevates Wave ② and Wave ③ confidence. When Wave ① contains this level of internal structural precision — including a contracting triangle iv and a clean v thrust terminal at 7,822.7 — the analytical confidence in both the Wave ② corrective targets and the Wave ③ bullish launch is significantly elevated. High-quality Wave ①s produce high-quality subsequent waves.
Expected Scenario and Potential Moves
The primary Elliott Wave scenario for US500 is clearly mapped:
Current Phase — Wave ② c-leg completing at 7,560–7,499:
S&P 500 declines from current price 7,654.6 toward:
TP1: 7,560.6 (0.5 Fibonacci — primary completion zone)
TP2: 7,499.0 (0.618 Fibonacci — deeper scenario; also the psychological 7,500 level)
The confluence of the 0.618 Fibonacci target with the significant psychological 7,500 level at TP2 creates a particularly strong structural buy zone if the c-leg extends beyond TP1.
Next Phase — Wave ③ advance from 7,560–7,499:
Wave ③ launches from the Wave ② completion zone, driving the most powerful bullish impulse toward and above 7,822.7. Extended Wave ③ projections point toward 8,000+ depending on Fibonacci extension measurements from the Wave ② low.
Key structural reference points:
7,822.7: Wave ① high — Wave ③ minimum threshold
7,775–7,780: b-wave high — immediate resistance
7,700: Near-term resistance
7,654.6: Current price — c-wave declining
7,598.0: Structural support reference
7,560.6: 0.5 Fibonacci — Wave ② TP1
7,499.0: 0.618 Fibonacci — Wave ② TP2 / psychological 7,500
7,299.6: (c)/2 structural base — hard invalidation floor
Strategic Perspective for Traders
1. The 7,560–7,499 zone is the most structurally significant buy setup in US500 right now. The confluence of the 0.5 and 0.618 Fibonacci levels creates a double Fibonacci support zone — and the 0.618 target aligning with the psychological 7,500 level makes the lower end of this zone particularly powerful. Double Fibonacci support zones following Wave ① completions with contracting triangle validations are among the most reliably bounced structural zones in equity index analysis.
2. The b-wave high at 7,775–7,780 defines the A-B-C character. The b-wave recovery to 7,775–7,780 — following the a-wave decline and before the c-wave — demonstrates that Wave ② is correctly structured as an A-B-C correction. The b-wave staying below the Wave ① high at 7,822.7 confirms the corrective character and keeps the structural count intact.
3. The 7,299.6 Invalid Level provides abundant structural clarity. With the Wave ② target at 7,560–7,499 and the hard invalidation floor at 7,299.6 — over 200 points below — the structural risk framework for Wave ③ positioning from the correction zone is exceptionally clear. Any H4 close below 7,299.6 would require fundamental reassessment; above it, the bullish structure remains fully intact.
4. The contracting triangle Wave iv validates the entire structural progression. As discussed, the textbook contracting triangle within Wave ① is the structural validation signal that elevates confidence throughout the entire wave sequence. The S&P 500 wave count is not just a pattern identification — it is a structurally confirmed Elliott Wave framework with internal precision at multiple levels.
5. Fed policy and macro data are the primary external variables. The S&P 500 is highly sensitive to Federal Reserve policy signals, employment data, and inflation readings. Any hawkish Fed surprise or significant macro deterioration could deepen the c-wave beyond TP2 toward the 7,400–7,450 area. However, as long as 7,299.6 holds, the larger bullish Wave ③ thesis remains structurally intact.
Conclusion — Follow S&P 500's Wave Structure With EWPlans
The S&P 500 is at a structurally precise and high-confidence moment. Wave ① completed at 7,822.7 with textbook internal precision — including the contracting triangle iv wave. Wave ② c-leg is targeting 7,560–7,499, and Wave ③ — the most powerful advance of the entire sequence from the 7,299.6 base — is the structural move that follows. The Elliott Wave map gives you the target zones, the entry levels, and the directional conviction. The S&P 500 structural bull run of 2026 is not over — it is loading for its most powerful phase.
At EWPlans, we publish H4 and D1 Elliott Wave analysis on US500 and 38 other instruments every single day. Our EWP Nexus-powered wave counts give equity index traders the structural framework to navigate the S&P 500's most significant corrective buy zones and position for the major Wave ③ advance before it launches.
👉 Get daily wave counts for S&P 500 and 38 more instruments — Start Your Analysis at EWPlans.com